10.2 Two-Samples: Hypothesis Testing on the Difference in Means
We are interested in testing the hypotheses:
\[H_0: \mu_1 - \mu_2 = 0 \] \[H_1: \mu_1 - \mu_2 \not= 0 \]
- The independent samples t-test will help us to compare the mean of the two groups.
- We can assume that devices corresponds to two unrelated/independent groups.
- The question to answer is: Is the mean price of the iPhone is statistically different from other smartphones?
We now consider an experimental design where we want to determine whether there is a difference between two groups within the population.
If \(\mu_1\) and \(\mu_2\) denote the mean value of group \(1\) and group \(2\), respectively, a mathematical representation of that hypothesis is:
\[H_0: \mu_1 - \mu_2 = 0 \]
\[H_1: \mu_1 - \mu_2 \not= 0 \]
For example, let’s suppose we want to test whether there is any difference between the effectiveness of a new drug for treating cancer. One approach is to create a random sample of 40 people, half of whom take the drug and half take a placebo. For this approach to give valid results it is important that people be assigned to each group at random. Such samples are independent.9
In order to choose the t-test to evaluate our hypothesis, we will consider these cases:
- When the population variances are known, hypothesis testing can be done using a Normal distribution.
- When the population variances are unknown, hypothesis testing can be done using a the \(t\) distribution with a pooled sample variance.
In the second case we consider three cases: - Independent samples and Equal variances - Independent samples and Unequal variances - Paired samples
The independent samples t-test (or unpaired samples t-test) is used to compare the mean of two independent groups.
For example, you might want to compare the mean weights of individuals grouped by gender: male and female groups, which are two unrelated/independent groups.
The independent samples t-test comes in two different forms:
- the standard Student’s t-test, which assumes that the variance of the two groups are equal.
- the Welch’s t-test, which is less restrictive compared to the original Student’s test. This is the test where you do not assume that the variance is the same in the two groups, which results in the fractional degrees of freedom.
The two-samples independent t-test assume the following characteristics about the data:
- Independence of the observations. Each subject should belong to only one group. There is no relationship between the observations in each group.
- No significant outliers in the two groups
- Normality. the data for each group should be approximately normally distributed.
- Homogeneity of variances. the variance of the outcome variable should be equal in each group.
Adapted from here
10.2.1 Independent samples and Equal variances
- \(x_{11},x_{12},\ldots,x_{1n_1}\) is a random sample of size \(n_1\) from population \(1\)
- \(x_{21},x_{22},\ldots,x_{2n_2}\) is a random sample of size \(n_2\) from population \(2\)
- The two populations represented by \(X_1\) and \(X_2\) are independent.
- Both population are normal.
- \(\bar{x_1}\) and \(\bar{x_2}\) are the sample means.
- \(s_1^2\) and \(s_1^2\) are the sample variances.
The quantity
\[T=\dfrac{(\bar{x}_1 - \bar{x}_2) - (\mu_1 - \mu_2)}{s_p \sqrt{\frac{1}{n_1}+\frac{1}{n_2}}}\]
has a \(t\) distribution \(n_1 + n_2 - 2\) degrees of freedom. Where \(s_p\) is called pooled variance
\[s_p^2 = \dfrac{(n_1-1)s_1^2 + (n_2-1)s_2^2 }{(n_1-1)+(n_2-1)}\]
10.2.2 Example
A company wants to improve its sales. It believes that the size of the shop has a big impact on the mean sale per transaction. Recent sales data were taken from 18 salesmen in 2 different shops (9 per shop). The company needs to confirm its suspicions.
- Data
\[ x_1= \{ 203, 229, 215, 220, 223, 233, 208, 228, 209 \} \]
\[n_1=9; \,\,\,\, \bar{x}_1=218.67 ; \,\,\,\, s_1 = 10.52\]
\[ x_2= \{ 221, 207, 185, 203, 187, 190, 195, 204, 212 \} \]
\[n_2=9; \,\,\,\, \bar{x}_2=200.44 ; \,\,\,\, s_2 = 12.13\] \[s_p^2 = \dfrac{(n_1-1)s_1^2 + (n_2-1)s_2^2 }{(n_1-1)+(n_2-1)}=\dfrac{1}{2}(810.52^2+12.13^2)= 128.9\]
\[s_p=11.35\]
- Hypothesis
\[H_0: \mu_1 = \mu_2 \,\,\,\,\,\, \text{ or } \,\,\,\,\,\, H_0: \mu_1 - \mu_2 = 0\]
\[H_0: \mu_1 \neq \mu_2 \,\,\,\,\,\, \text{ or } \,\,\,\,\,\, H_0: \mu_1 - \mu_2 \neq 0\]
- Test statistic
\[T=\dfrac{(\bar{x}_1-\bar{x}_2)-(\mu_1-\mu_2)}{s_p \sqrt{ \frac{1}{n_1} + \frac{1}{n_2} } } = \dfrac{(218.67-200.44)-(0)}{11.35\sqrt{\frac{1}{9} + \frac{1}{9}}}= 3.4049 \]
- Decision
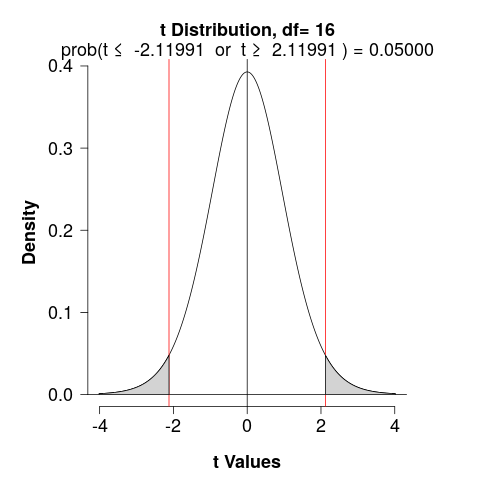
- Critical Value
We would reject \(H_0\) if \(T\) were less than \(t_\alpha\) or greater than \(t_\alpha\) (determined used a \(t\)-table)
\[\alpha = 0.05; \,\, df = n_1+n_2-2 =16\]
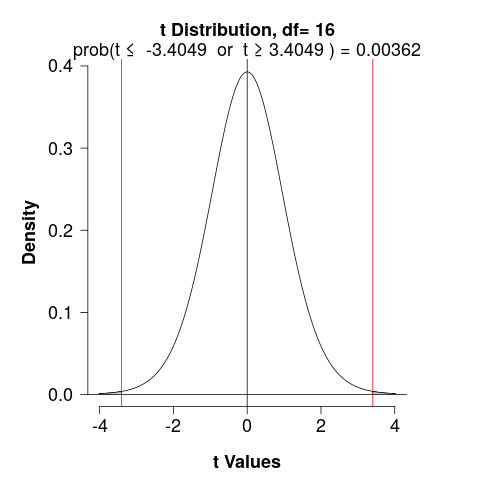
- p-value
We would determine the area under a \(t_{df}\) curve, to the right of \(T\) and to the left of \(-T\)
\[T = \pm 3.4049; \,\, df = 16\]
- Interpretation
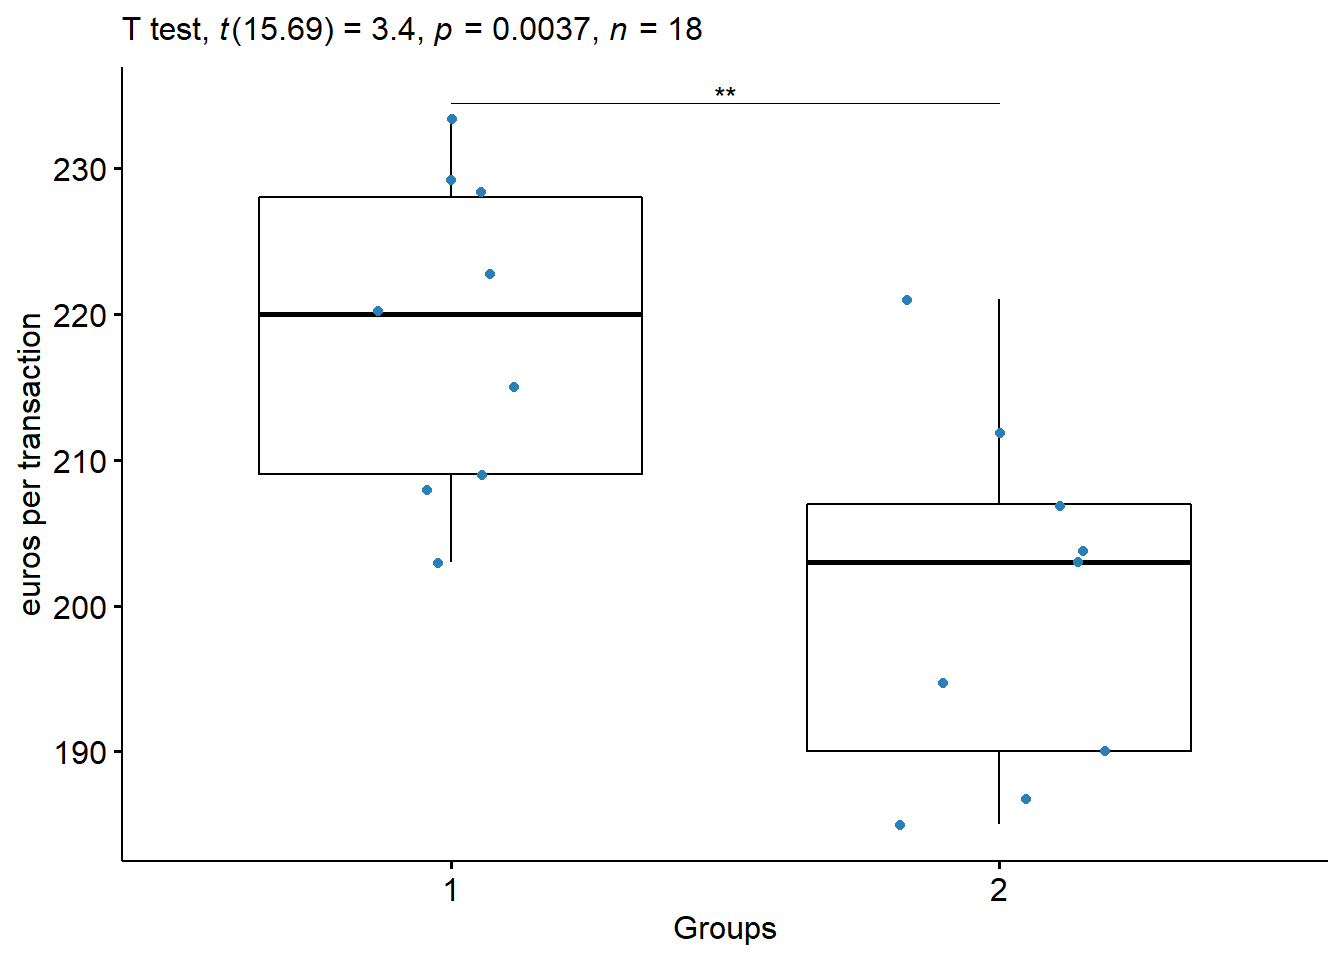
There is sufficient evidence, at the \(\alpha= 0.05\) level, to conclude that the mean sale per transaction is different between the two shops.
- Reporting
The mean sale in shop 1 was 218.67 (sd = 10.52), whereas the mean in shop 2 was 200.44 (sd = 12.13). A two-samples t-test showed that the difference was statistically significant, t(16) = 3.4049, p < 0.0036; where, t(16) is shorthand notation for a t-statistic that has 16 degrees of freedom.
| .y. | group1 | group2 | n1 | n2 | statistic | df | p | p.signif |
|---|---|---|---|---|---|---|---|---|
| x | 1 | 2 | 9 | 9 | 3.404865 | 15.68926 | 0.00371 | ** |
- The company thinks that there is a difference (that the mean sales are bigger in the first shop). Test this hypothesis.